
Explore 2026 ecommerce conversion rate benchmarks, global trends, and proven strategies to optimize traffic, boost sales, enhance user experience, and maximize ROI effectively.
Some online stores have the golden touch and rake in profits, while others barely scrape by despite getting lots of traffic. The difference is often in how they manage to convert browsers into buyers. That magic number is known as the ecommerce conversion rate.
Boosting your conversion rate can make a huge difference, even if it is a marginal increase without extra ad spend. Knowing where you stand and what’s working in 2026 is essential.
In this guide, we’re unpacking the real numbers behind ecommerce conversion rates today in 2026. You’ll see what’s “normal,” what top-performing stores are doing differently, and how you can take your own numbers from meh to meaningful, without reinventing the wheel.
For deeper insights into online performance trends, exploring global ecommerce stats can help you compare benchmarks, understand international growth patterns, and discover strategies successful online retailers are using worldwide.
What Is Ecommerce Conversion Rate?
Ecommerce conversion rate is the percentage of people visiting your site and doing something you want, like buying a product. But it’s not just about making a sale. A conversion could also mean someone signs up for your emails, adds something to their cart, or clicks a button that moves them closer to buying
Here’s the formula:
(Conversions ÷ Total Visitors) x 100
So, if 100 people land on your site and 5 of them buy something, your conversion rate is 5%. This basic calculation can offer valuable insight about your store’s effectiveness and performance.
Tracking those actions helps you see where people drop off. If many users add to cart but never check out, that’s a signal. Something’s stopping them, and knowing whether it’s an inconvenient checkout or paying shipping costs is vital. Knowing your conversion rate and which conversion you’re measuring helps you ask the right questions.
A conversion rate is one of the clearest key performance indicators of whether your website transforms clicks into actual buyers or qualified leads. If you’re not monitoring conversion, it’s as good as operating without a roadmap.
Why Is Ecommerce Conversion Rate Important?
Getting visitors is the first step, as it doesn’t guarantee success. What’s essential is engagement on your site. Thus, monitoring your conversion rate becomes crucial, directly driving revenue and impacting your bottom line.
Improving your conversion rate means you’re doing more with what you already have. It’s a cost-effective way to grow. Also, when margins are tight (as they often are), that’s not just smart; it’s essential. It also exposes weak spots. Let’s assume your traffic is solid, but your conversion rate is tanking. That’s a red flag and implies that something in the user experience might be off. A low conversion rate is often a symptom; diagnosing it helps you fix the real problem.
Here’s the kicker: it tells you if your marketing is actually working. Are your landing pages delivering? Is your messaging clicking? Your conversion rate answers these questions, as it is an unavoidable metric with the correct answers. So, if you’re serious about ecommerce growth, you must keep checking it.
What’s a Good Ecommerce Conversion Rate in 2026?
There is no one-size-fits-all answer to a reasonable ecommerce conversion rate, but let’s examine some numbers.
The conversion rate across most ecommerce sites is between 2% and 3%. This is a ballpark of the global average, depending on the source. While it’s not bad, it’s not trailblazing either.
Now, if you’re aiming high, as you should, the top 20% of online stores push well past that. We’re talking 3.5% to 5% and beyond. Some niche stores even break into double digits. How? Smart pricing, killer UX, and clear customer intent.
Here’s the thing: what counts as “good” depends on your business. A site selling $15 t-shirts won’t convert the same as one offering $1,500 sofas. Also, is someone browsing casually versus urgently shopping for a gift? That intent matters.
Now, throw 2026 into the mix. Mobile behavior dominates, with people shopping between tasks on smaller screens with shorter attention spans. Inflation is shifting spending habits. AI tools are helping customers find what they want quickly, or walk away just as quickly.
Global Average Conversion Rates
Let’s break down the averages with actual data. According to Invesp, the global ecommerce conversion rate sits around 2.35%. Adobe puts the number slightly lower. Statista and Shopify both report similar figures, somewhere between 2% and 3% for most industries.
That’s the baseline. But some countries outperform the pack. Stores in Germany, the UK, and the Netherlands tend to convert better, often touching 3.5%. This is due to strong digital infrastructure, better user trust, and smoother payment systems. In contrast, developing markets may show lower averages. It’s not a tech gap but more about access, confidence, and digital literacy.
Device matters, too. Desktop users still convert higher than mobile users because they’re in “serious shopping mode.” But mobile is catching up fast, especially with younger audiences who live on their phones and shop without switching to a bigger screen.
So, while the “average” sits around 2%, it’s just a starting point. Context is everything. Where you sell, how you sell, and who you sell to all change the game.
Improving conversions starts with knowing how to optimize eCommerce product pages, ensuring better visibility, smoother experiences, and higher sales across all devices.
Conversion Rate Benchmarks by Device
Below are some details of the device division.
Recent reports show desktop users consistently have the highest conversion rates, at around 2.6% on average. When people shop on a computer, they tend to be more focused, with fewer distractions, a bigger screen, and an easier checkout.
Average rates for mobile hover closer to 1.8% to 2.3%. The friction caused by slow-loading pages, tiny buttons, and awkward forms drives significant drop-offs.
Tablets fall somewhere in between. They are not as strong as desktops but, in some cases, better than mobiles, especially for older users or more expensive purchases.
Over 70% of ecommerce visits happen on phones. So if your mobile site isn’t slick, you’re leaking conversions.
In 2026, mobile-first isn’t just a suggestion; it’s survival. They can be optimized for thumb taps, speed up your site, and keep it simple. If your site frustrates shoppers on the go, then they’ll bounce faster than you can say “add to cart.”
Boosting visibility isn’t just about design—using smart ecommerce link building tactics can attract qualified traffic and ultimately improve conversion rates across devices.
Conversion Rates by Traffic Source
Most people do not realize that where your visitors come from matters greatly. A click is never just a click; it comes with intent, expectations, and context. A person’s mindset also comes into play, as someone who finds you through a Google search has a different thought process than someone who scrolls past your ad on Instagram.
Warm traffic refers to people already familiar with your brand, resulting in more conversions. Cold traffic, not so much. But both have their place. Let’s break it down by source.
SEO
Organic traffic is gold despite being slow to build, as it is loaded with potential. When someone types a long, specific search into Google and lands on your product page? That’s the intent. They’re already looking for what you offer. So, if your SEO game is strong with clean site structure, fast load times, and helpful content, you’re more likely to win that click.
Think “pastel bullet journal with dotted pages” instead of just “journal.” These users aren’t window shopping; they have a need and hope your store is the answer. That’s why SEO traffic often converts better than expected if your content matches what the user actually came for.
Staying updated with the latest ecommerce SEO trends helps you capture high-intent traffic, improve visibility, and drive stronger conversions from organic searches.
PPC
Paid traffic can be powerful, but only when handled right. Google Shopping ads and branded search terms usually bring higher conversion rates than display ads. This is because shoppers who click those are already close to deciding. On the other hand, display network visitors are often just curious.
Conversion rates vary, but 2% to 4% is a solid benchmark for most paid campaigns. Your ad copy and landing page must match to get the most out of your budget. So if you get sloppy, you’ll pay for clicks that go nowhere.
Social Media
Social traffic is tricky, as it brings volume but not always conversions. People don’t open Instagram or TikTok to shop. They’re scrolling to unwind and get entertained. But that doesn’t mean they won’t buy; just don’t expect them to do it immediately.
Instagram and Facebook drive better ecommerce results, especially when paired with solid retargeting. TikTok is great for sparking interest but often needs a few follow-ups to convert.
The bottom line is that social is top-of-funnel. Don’t expect immediate conversions, but plant the seed well, and they’ll come back ready.
Email converts better than any other channel. The reason is that you’re talking to people who already care. They’ve signed up, bought before, and know your brand. That’s warm traffic in its purest form.
To boost conversions, start segmenting your list. Talk to returning buyers differently from first-timers, and add abandoned cart emails. Those alone can recover 10–15% of lost sales.
With solid personalization (like using their name or recommending based on past buys), you have a recipe for results. When done right, email doesn’t just drive conversions; it builds loyalty that pays off repeatedly.
Improving channels like email and social doesn’t just lift conversions—it also increases your average order value, driving greater revenue per customer.
Ecommerce Conversion Rate Statistics by Industry
Looking at overall conversion rates is fine, but let’s be real, it’s not the whole picture. Industry benchmarks give you a better sense of what “good” actually looks like for your niche.
Some industries have quick, impulse-driven purchases, while others take time. Product type, pricing, and how people shop in your space affect the numbers. Let’s break it down.
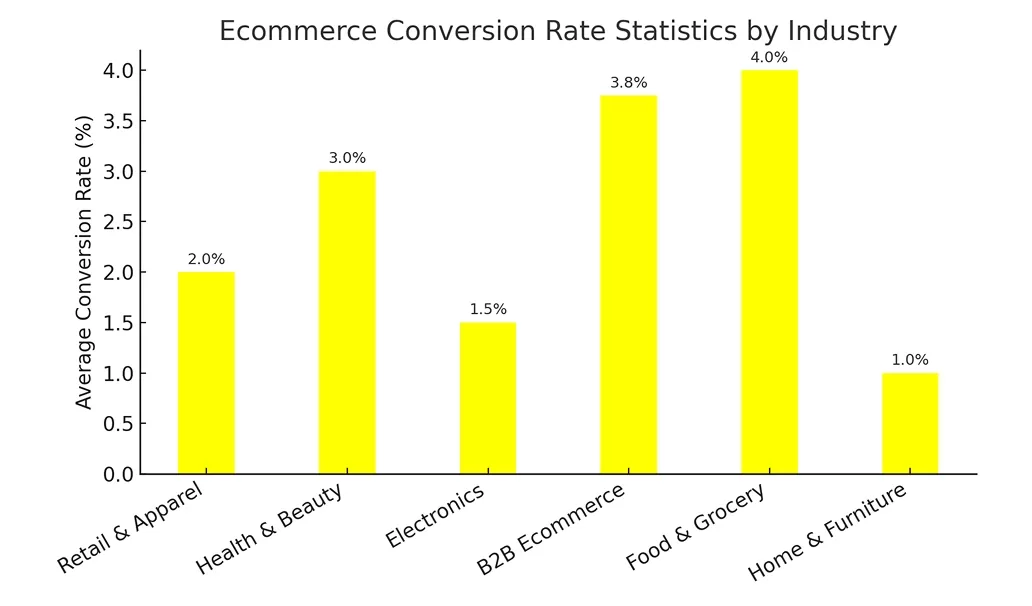
Retail & Apparel
Retail and fashion websites average roughly 1.5% to 2.5%, which can spike during holiday seasons or big sales.
A high-traffic category, it comes with friction. Sizing uncertainty, product variety, and style preferences make buyers hesitate. Return policies also affect how confident people feel about clicking “buy.”
In the fast-moving fashion industry, freshness matters. So, more visuals and a seamless browsing experience result in better chances for you.
Health & Beauty
This space sees conversion rates around 2.5% to 3.5%, often climbing higher with the help of subscriptions or auto-refill options.
This boost is seen as people tend to reorder skincare, supplements, or personal care products they like. Trust is everything here, as reviews, ingredient breakdowns, and “how-to” content can seal the deal.
Video tutorials and influencer demos don’t just entertain; they give hesitant buyers the confidence to commit.
Electronics
Electronics convert lower, averaging between 1% and 2%. The price tag is higher, and so is the hesitation.
People want to compare, research, and double-check specs. They don’t impulse-buy a $900 laptop. They bookmark it, come back, and think again.
If your product pages aren’t clear and packed with helpful information, such as charts, tech specs, and side-by-sides, you’ll lose them to someone who is.
B2B Ecommerce
This is a different beast. Conversion rates tend to land between 3% and 4.5%, sometimes higher depending on the offer.
The audience is smaller but more focused, and each sale’s value is often way bigger.
Decision-making takes longer, as buyers usually want quotes, bulk options, and proof that you can deliver at scale. So, your conversion numbers will look better if you have a smoother process.
Food & Grocery
Ecommerce for food and groceries often sees strong rates around 3% to 5%. This is especially common for local delivery services or niche food brands.
Shoppers in this space know what they want. They’re restocking essentials or grabbing ingredients for dinner. That’s quick-decision territory.
Freshness, delivery timing, and availability drive trust. Loyalty builds fast here if your service is reliable.
Home & Furniture
This category has the lowest average rates, usually between 0.5% and 1.5%. That’s not failure but the nature of high-stakes shopping.
Buying a couch isn’t like shopping for a T-shirt. People measure, then measure again. They compare colors, prices, sizes, and styles.
That’s why visuals matter more here than almost anywhere else. Sharp images, 3D previews, and AR tools that let shoppers “place” a sofa in their space are just revolutionary.
Specs are essential, but today’s buyers want a mental picture of that couch in their living room. If you help them see it, they’ll likely buy it.
Year-by-Year Conversion Rate Trends (2020–2026)
Looking at conversion rates year by year shows the actual picture apart from numbers, as it reflects the story behind the clicks. When brands track these changes, they stop guessing and start adjusting. Small trend lines reveal significant consumer behavior shifts.
Pre- vs. Post-COVID Trends
2020 changed everything.
When COVID hit, people had to switch to online shopping, and sent ecommerce conversion rates soaring across industries. Some stores saw double-digit CR spikes practically overnight.
But as panic buying settled, 2021 brought a return to earth. Rates dipped as supply chains strained and buyer confidence shifted. People got more selective.
The trend evened out post-2022. Shoppers again had more choices, tools, and patience. Ecommerce didn’t shrink, but it matured. The brands with clear policies, solid UX, and fast delivery managed to stay ahead.
Today, in 2026, we’re in a new normal. The spikes are no longer present, but smarter shopping habits have remained. That shift matters more than any single-year number.
To measure improvements effectively, using a conversion rate calculator helps track performance over time and compare benchmarks across different years.
Notable Changes in Consumer Behavior
Online shopping today is vastly different from five years ago.
Mobile is king. Mobile traffic was rising in 2020, while in 2026, it dominates. You’re out of the game if your store doesn’t load fast and look clean on a phone.
Shoppers now expect personalization; not just “Hey, [First Name]” emails, but innovative product suggestions, dynamic homepages, and helpful search filters. If your site feels generic, it feels forgettable.
What to Expect for the Rest of 2026
Conversions depend less on first impressions and more on ongoing connection throughout the year.
AI tools have already transformed product discovery. With smart search, personalized recommendations, and dynamic landing pages, conversion rates are increasing, especially for repeat customers.
While not mainstream yet, voice search is slowly but steadily gaining ground. More shoppers ask Alexa or Google Assistant to “budget kawaii stationery” or “reorder organic beauty products.” Sites optimized for voice queries will see that payoff grow.
Expect more purchases coming from loyalty, not first-time buyers. Repeat customers are key. Brands that build trust and stay consistent will win more second, third, and fourth sales.
Content matters more than ever. Product pages that read like they were written by a human (not a spreadsheet) will outperform the rest.
The rest of 2026 is about getting the basics right and making the online experience feel personal, fast, and smooth.

Factors That Influence Conversion Rates
Conversion rates don’t exist in a vacuum. They’re shaped by internal and external factors, from your site’s layout, the state of the economy, how fast your site loads, and how easy it is to check out.
That sale might vanish if just one step in the journey feels off. So let’s look at what really moves the needle.
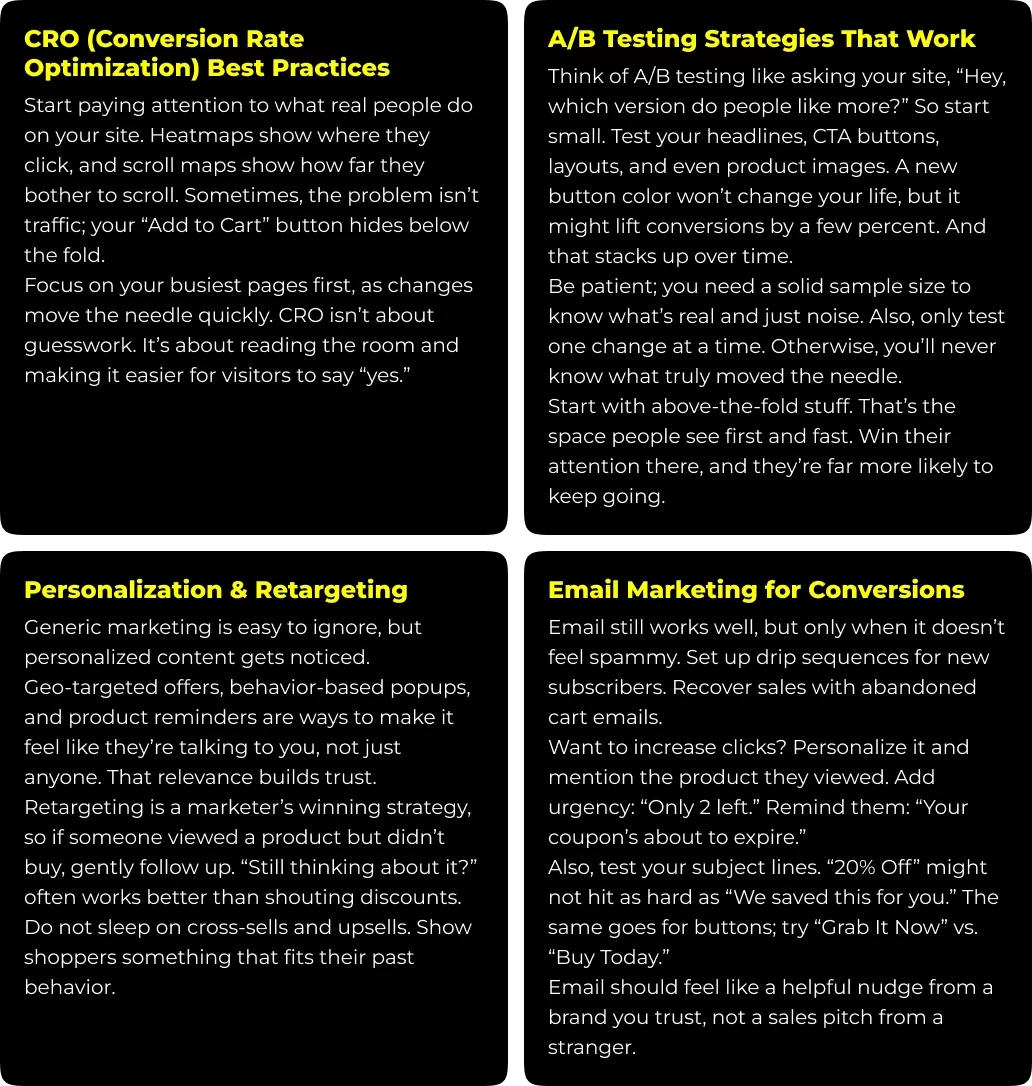
Website Speed & UX
Speed isn’t just nice to have; it’s critical. People will bounce if your site takes more than a few seconds to load. Google’s Core Web Vitals say it all. Sites that load quickly tend to hold attention longer and convert better. However, load times, clean navigation, intuitive menus, and a mobile-friendly design all matter greatly.
So your site is like a store. If the layout is messy and slow, people will walk out. If it’s smooth and precise, they will stick around and buy.
Understanding how page speed affects search ranking gives clarity on why fast-loading sites earn better visibility, improved engagement, and stronger conversion rates.
Product Pages & Copywriting
Your product page is crucial, so make every word count.
Keep the content easy to understand, ditch the jargon, and say precisely what the shopper needs to know, such as key features. Shoppers should not have to go through paragraphs to find the necessary information.
Photos and videos help more than you’d think. Lifestyle shots and 360° product views, demos, and even quick explainers can boost confidence and reduce returns. Size guides and spec sheets are lifesavers for high-consideration items.
Checkout Process Optimization
Cart abandonment is a silent killer, as nearly 70% of shoppers bail before finishing.
Sometimes, it’s the small stuff: too many steps, surprise fees, or limited payment options. One-page checkouts often convert better than drawn-out multi-step flows. But test it, as your target audience may behave differently.
Let shoppers check out as guests, as not everyone wants to create an account just to buy a pair of socks. Also, remember to offer multiple payment options, including credit cards, wallets, and maybe even Buy Now, Pay Later (BNPL).
So make it easy, make it fast, or they’ll make their exit.
Pricing & Offers
Price matters, but it’s more psychological than you’d expect. $29.99 feels way better than $30, even though it’s essentially the same. Bundle deals work well too—“Buy 2, Get 1 Free” sounds like a win.
First-time buyer discounts, flash sales, and urgency messages like “Only 3 left!” can trigger action.
Remember your return policy. A vague or hard-to-find policy kills trust, while a clear, fair policy makes people feel safe hitting that buy button.
Trust Signals & Reviews
People shop from trustworthy brands. Showing genuine reviews and star ratings is great. But adding photos or short video testimonials is even better, as they quickly add credibility.
SSL badges, verified payment logos, and trust seals show you’re secure. These are small details with a significant impact.
Build authenticity with user-generated content (UGC) like customer selfies or TikToks. It says, “Real people love this”; that’s more convincing than any ad.
Ultimately, conversion isn’t just about clicks but about confidence.
Learning how to get more google reviews helps strengthen trust signals, build authenticity, and increase shopper confidence in your brand.
How to Improve Your Ecommerce Conversion Rate
There’s no secret sauce or plug-and-play fix that works for all stores. Every store is different; what works for one will not always work for another.
That’s why improvement starts with curiosity. You test, tweak, and learn; those small changes add up to big wins.
Tracking email marketing stats helps you refine campaigns, boost engagement, and turn personalized messages into stronger conversions.
Conclusion
Improving your conversion rate is ongoing work and is never “done.” So do not miss out on tracking your numbers and watching consumer behavior. Don’t just guess; instead, observe, adjust, and repeat. What worked last quarter might fall flat today. That’s normal; as trends change, habits shift, so stay curious.
The best sites don’t just sell; they attract shoppers, remove friction, and make choices feel easy. So, if you feel stuck, zoom in and use one page, one button. Or get someone outside your team to walk through the site; you’d be surprised what fresh eyes see. So that next big jump could be one small change away.
Frequently Asked Questions (FAQs)
What is the average ecommerce conversion rate in 2025?
In 2025, most ecommerce stores see an average conversion rate of 2% to 3%. Averages only tell one aspect of the story. Some niche stores see 4% or higher, especially for those selling budget-friendly or everyday items. If you’re below 1%, it’s not the end of the world. But there’s always room to improve, so use the industry average as a guide.
What’s the best industry for ecommerce conversion?
Some industries, like food, beauty, and groceries, convert better than others. This is due to low-friction purchases and high repeat rates. It’s easier to sell a $12 face serum or a snack bundle than a $1,200 sofa. Also, daily-use products lead to repeat business, which raises your overall conversion rate, as people often return. These industries win because of what they sell and how people usually want to repurchase it.
How often should I track conversion rates?
Conversion rates should be tracked often, especially during ads or big promotions. This helps catch issues early, before they cost you real money. You don’t need fancy tools; a simple Google Analytics or Shopify setup works well. The key is to watch the numbers and actually do something with them. If your rate dips, ask why, and then adjust.
What’s the difference between CR and ROI?
Conversion rate (CR) tells you how many visitors are taking the action you want, like making a purchase. It’s a percentage based on traffic. Return on investment (ROI) tells you if all that effort is worth it. It compares what you spend to what you earn. Together, CR and ROI give you a fuller picture of what’s working and what needs work.
Do ecommerce conversion rates vary by traffic source?
Yes. Email tends to convert the most. The following conversions are through SEO traffic, especially when you rank for high-intent, long-tail keywords. Paid search can be hit or miss. Social traffic is usually lower-converting. So it comes down to intent. The closer someone is to buying, the better chance you’ve got of turning that visit into a sale.